קובץ:MultivariateNormal.png
קפיצה לניווט
קפיצה לחיפוש
גודל התצוגה המקדימה הזאת: 793 × 600 פיקסלים. רזולוציות אחרות: 317 × 240 פיקסלים | 635 × 480 פיקסלים | 842 × 637 פיקסלים.
לקובץ המקורי (842 × 637 פיקסלים, גודל הקובץ: 159 ק"ב, סוג MIME: image/png)
תקציר
| תיאור |
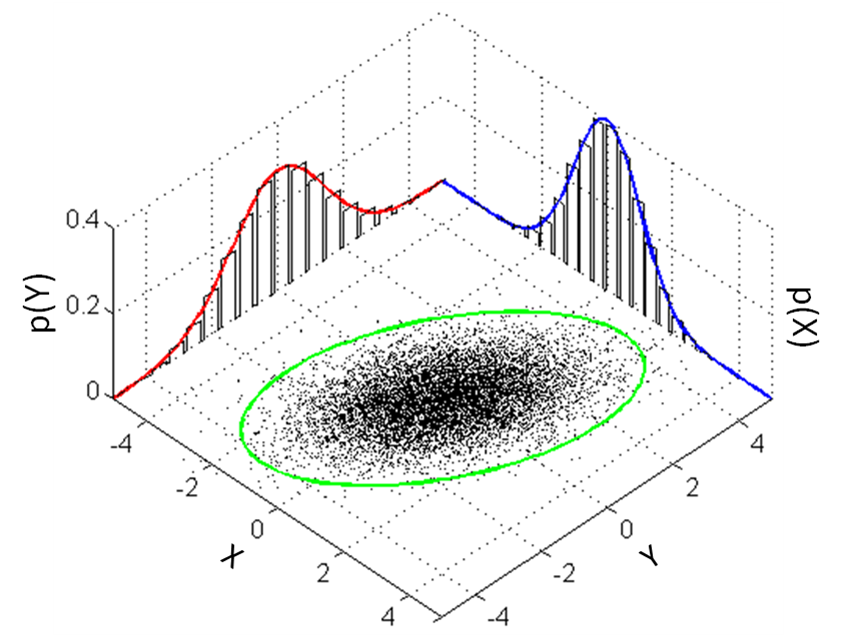
English: Illustration of a multivariate gaussian distribution and its marginals. Matlab code provided below. |
|||
| תאריך יצירה | ||||
| מקור | נוצר על־ידי מעלה היצירה | |||
| יוצר | Bscan | |||
| גרסאות אחרות |
|
|||
| PNGהתפתחות |


Source code
%This script illustrates a multivariate Gaussian distribution and its
%marginal distributions

%This code is issued under the CC0 "license"

%Define limits of plotting
X = -5:0.1:5;
Y = -5:0.1:5;

%2-d Mean and covariance matrix
MeanVec = [0 0];
CovMatrix = [1 0.6; 0.6 2];

%Get the 1-d PDFs for the "walls"
Z_x = normpdf(X,MeanVec(1), sqrt(CovMatrix(1,1)));
Z_y = normpdf(Y,MeanVec(2), sqrt(CovMatrix(2,2)));

%Get the 2-d samples for the "floor"
Samples = mvnrnd(MeanVec, CovMatrix, 10000);

%Get the sigma ellipses by transform a circle by the cholesky decomp
L = chol(CovMatrix,'lower');
t = linspace(0,2*pi,100); %Our ellipse will have 100 points on it
C = [cos(t) ; sin(t)]; %A unit circle
E1 = 1*L*C; E2 = 2*L*C; E3 = 3*L*C; %Get the 1,2, and 3-sigma ellipses

figure; hold on;
%Plot the samples on the "floor"
plot3(Samples(:,1),Samples(:,2),zeros(size(Samples,1),1),'k.','MarkerSize',2)
%Plot the 1,2, and 3-sigma ellipses slightly above the floor
%plot3(E1(1,:), E1(2,:), 1e-3+zeros(1,size(E1,2)),'Color','g','LineWidth',2);
%plot3(E2(1,:), E2(2,:), 1e-3+zeros(1,size(E2,2)),'Color','g','LineWidth',2);
plot3(E3(1,:), E3(2,:), 1e-3+zeros(1,size(E3,2)),'Color','g','LineWidth',2);

%Plot the histograms on the walls from the data in the middle
[n_x, xout] = hist(Samples(:,1),20);%Creates 20 bars
n_x = n_x ./ ( sum(n_x) *(xout(2)-xout(1)));%Normalizes to be a pdf
[~,~,~,x_Pos,x_Height] = makebars(xout,n_x);%Creates the bar points
plot3(x_Pos, Y(end)*ones(size(x_Pos)),x_Height,'-k')

%Now plot the other histograms on the wall
[n_y, yout] = hist(Samples(:,2),20);
n_y = n_y ./ ( sum(n_y) *(yout(2)-yout(1)));
[~,~,~,y_Pos,y_Height] = makebars(yout,n_y);
plot3(X(1)*ones(size(y_Pos)),y_Pos, y_Height,'-k')

%Now plot the 1-d pdfs over the histograms
plot3(X, ones(size(X))*Y(end), Z_x,'-b','LineWidth',2);
plot3(ones(size(Y))*X(1), Y, Z_y,'-r','LineWidth',2);

%Make the figure look nice
grid on; view(45,55);
axis([X(1) X(end) Y(1) Y(end)])
רישיון
Bscan, בעל זכויות היוצרים על היצירה הזאת, מפרסם אותה בזאת תחת הרישיון הבא:
| הקובץ הזה זמין לפי תנאי ההקדשה עולמית לנחלת הכלל CC0 1.0 של קריאייטיב קומונז. | |
| האדם ששייך יצירה להיתר הזה הקדיש את היצירה לנחלת הכלל על־ידי ויתור על כל הזכויות שלו או שלה על היצירה בכל העולם לפי חוק זכויות יוצרים, לרבות כל הזכויות הקשורות או הסמוכות כקבוע בחוק. באפשרותך להעתיק, לשנות, להפיץ, או להציג את היצירה, אפילו למטרות מסחריות, וכל זה אפילו מבלי לבקש רשות.
|
היסטוריית הקובץ
ניתן ללחוץ על תאריך/שעה כדי לראות את הקובץ כפי שנראה באותו זמן.
| תאריך/שעה | תמונה ממוזערת | ממדים | משתמש | הערה | |
|---|---|---|---|---|---|
| נוכחית | 20:30, 22 במרץ 2013 | | 637 × 842 (159 ק"ב) | wikimediacommons>Bscan | User created page with UploadWizard |
שימוש בקובץ
הדף הבא משתמש בקובץ הזה: