קובץ:WeierstrassFunction.svg
קפיצה לניווט
קפיצה לחיפוש

גודל התצוגה המקדימה הזאת מסוג PNG של קובץ ה־SVG הזה: 795 × 505 פיקסלים. רזולוציות אחרות: 320 × 203 פיקסלים | 640 × 407 פיקסלים | 1,024 × 650 פיקסלים | 1,280 × 813 פיקסלים | 2,560 × 1,626 פיקסלים.
לקובץ המקורי (קובץ SVG, הגודל המקורי: 795 × 505 פיקסלים, גודל הקובץ: 120 ק"ב)
תקציר
| תיאור |
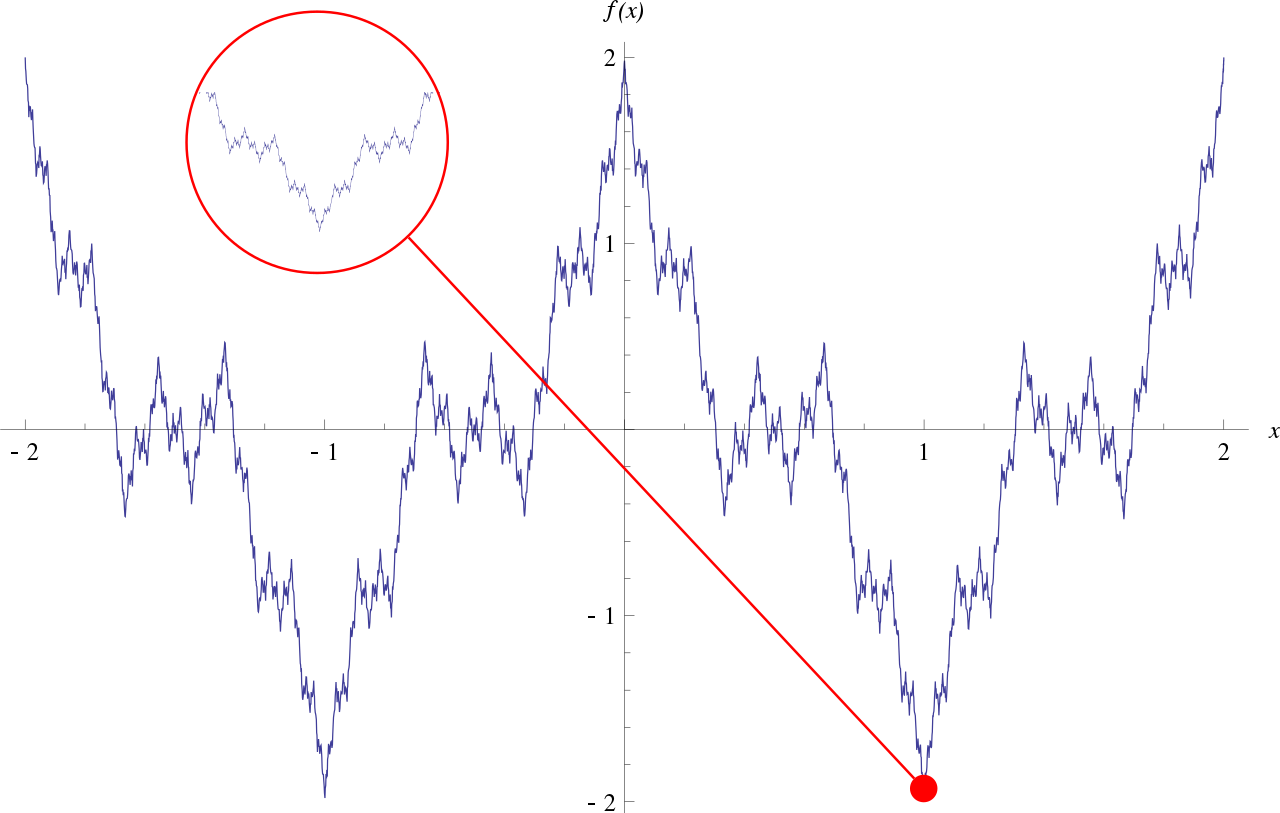
English: Plot of the Weierstrass function. A section of the plot is zoomed in on to illustrate the fractal nature of the function. The plot was generated using Mathematica and exported to SVG. I first made a plot of the region and then a plot of a much smaller section around the red point on the image. With the use of Inkscape, I was able to put the two in the same SVG file. This file is an Inkscape SVG, not a plain SVG. |
| תאריך יצירה | |
| מקור | נוצר על־ידי מעלה היצירה |
| יוצר | Eeyore22 |
| גרסאות אחרות | File:Weierstrass_function.gif |
רישיון
| ברצוני, בעלי זכויות היוצרים על יצירה זו, לשחרר יצירה זו לנחלת הכלל. זה תקף בכל העולם. יש מדינות שבהן הדבר אינו אפשרי על פי חוק, אם כך: אני מעניק לכל אחד את הזכות להשתמש בעבודה זו לכל מטרה שהיא, ללא תנאים כלשהם, אלא אם כן תנאים כאלה נדרשים על פי חוק. |
היסטוריית הקובץ
ניתן ללחוץ על תאריך/שעה כדי לראות את הקובץ כפי שנראה באותו זמן.
| תאריך/שעה | תמונה ממוזערת | ממדים | משתמש | הערה | |
|---|---|---|---|---|---|
| נוכחית | 01:44, 27 באוקטובר 2008 | | 505 × 795 (120 ק"ב) | wikimediacommons>Eeyore22~commonswiki | {{Information |Description={{en|1=Plot of the Weierstrass function. A section of the plot is zoomed in on to illustrate the fractal nature of the function.}} |Source=Own work by uploader |Author=Eeyore22 |Date=October 26, 2008 |Permissio |
שימוש בקובץ
הדפים הבאים משתמשים בקובץ הזה: